SESDA II staff help lead the way with visualization of A-Train data using Giovanni and Google Earth
December 7, 2009
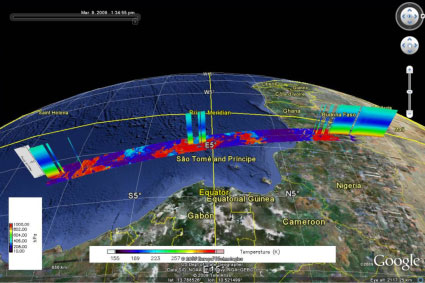
The combination of Giovanni and Google Earth allows striking visualization of data from the “A-Train” satellite constellation. SESDA II staff helped develop the Giovanni Google Earth visualization capability which uses the A-Train constellation data to provide users with ability to visualize both vertical data curtain plots and surface strips for the same temporal and spatial range. Researchers can now select a specific temporal/spatial range to obtain KMZ files (Google Earth native formats) with vertical information (temperature, water vapor, clouds, aerosols, etc.) and surface swaths (cloud pressure, cloud top temperature, cloud cover, etc.) which can be subsequently downloaded and viewed in a Google Earth browser.

This image shows a visualization of the Atmospheric Temperature Vertical Profile and Cloud Top Pressure Surface Strips from MODIS-Aqua on March 9th, 2009 over the regions in the equatorial Africa. Note that the image is oriented with North to the right.
Comments are closed.
-
Article Details:
Posted on: Monday, December 7th, 2009
Posted in: SESDA News
Subscribe: RSS 2.0
Comments: No Responses -
Recent News:
